Building Torn City API Scripts with Google Apps Script

Audience
Ideally you are familiar with Torn City but if you aren't don't worry. At the very least you're somewhat familiar with Application Programming Interfaces (APIs) and know some basic programming.
Together, we're going to build a script to generate a graph of a stock's price history over the last hour.
Contents
1. Introduction
The text-based MMO called Torn City exposes a free-to-use API for their playerbase. In this tutorial we're going to build a simple Google Apps Script-based script to call the API and generate a graph of a particular stock's prices over the last hour:

How it works:
- The user enters their Torn City API key.
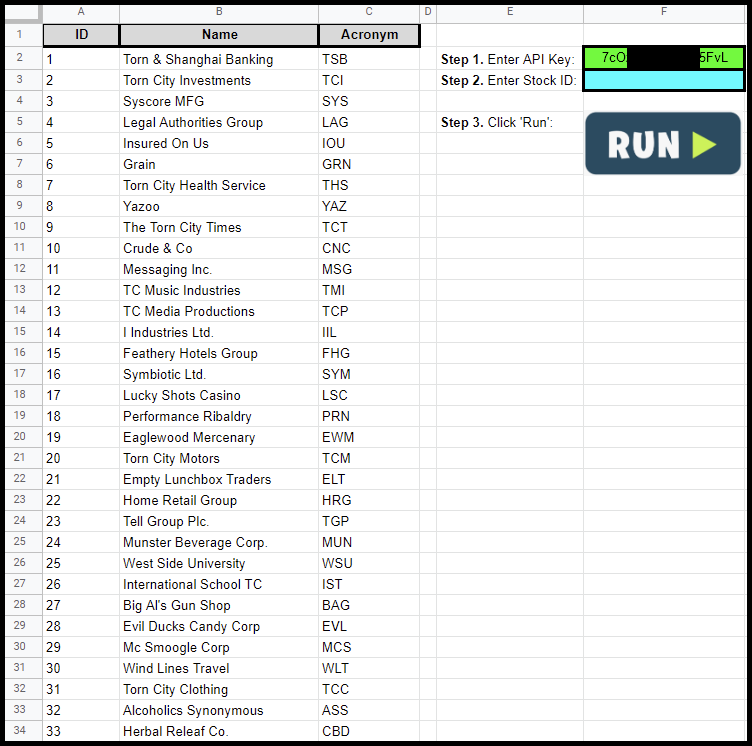
- The user enters the Stock ID. A reference table is provided with the stock ID, name, and acronym.
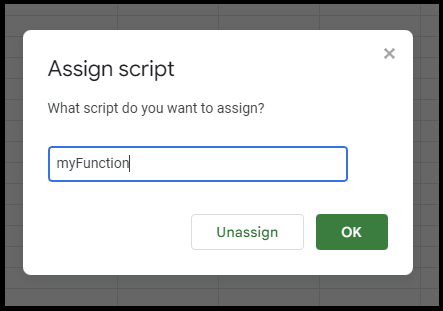
- The user clicks the "Run" button. The button is an image with a script/function attached that is called when the image is clicked.
- The function calls the Torn City API, parses the JSON response, and populates the stock price history table in the spreadsheet.
- The Google Sheet uses the timestamps and prices to auto-populate the graph.
2. Prerequisites
There are a couple things we need to do first:
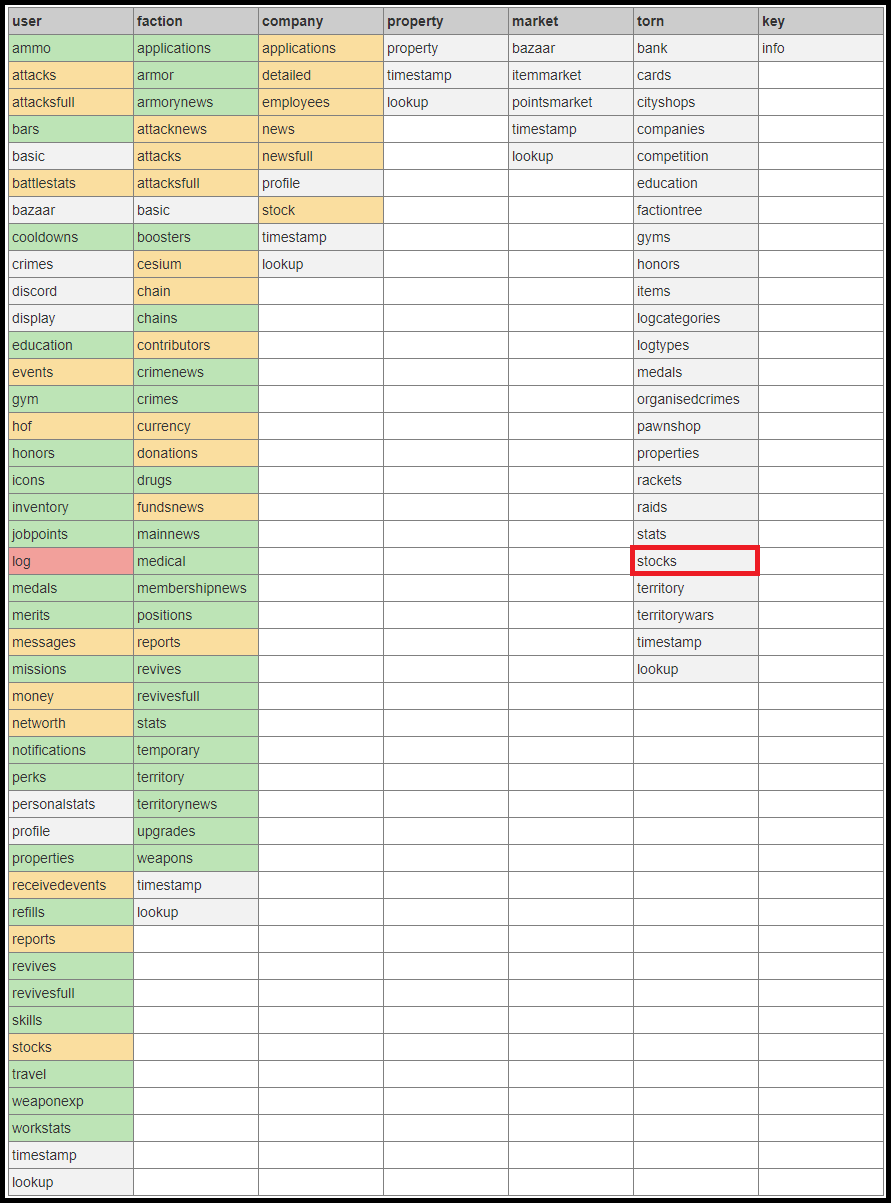
- Familiarize yourself with the Torn City API Documentation
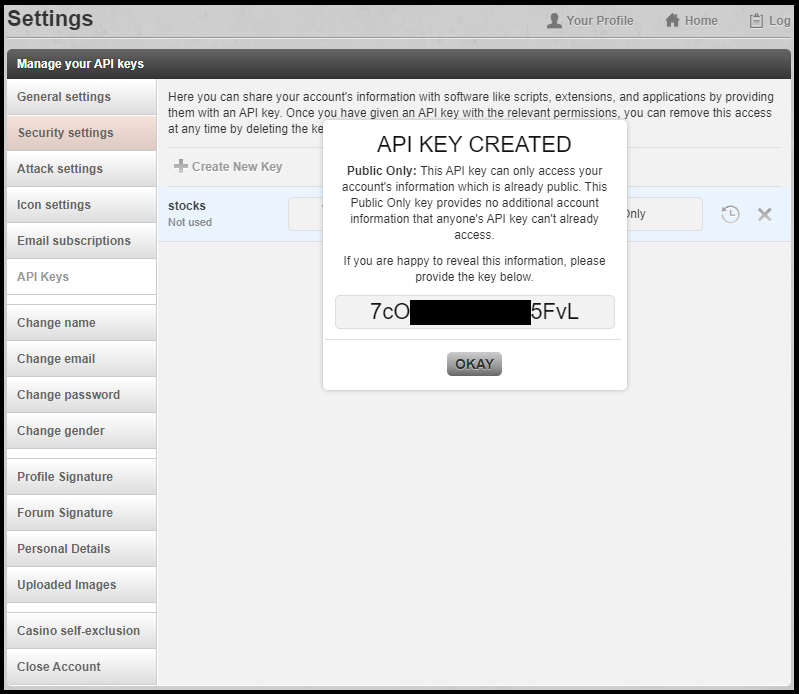
- Create an API key with Public Access Level
- Create a new Google Spreadsheet
There's like a hundred words tops. Don't be lazy. RTFM.
You need a Torn City account for this step.
We are getting calling the API for stocks data which can be found in the "torn" column of the table in the documentation. This requires an API key with only a Public access level.
The API key is created by going into your profile settings and selecting "API Keys" from the menu. Choose "Public Only" from the drop down menu, give it a name, and click "Add":
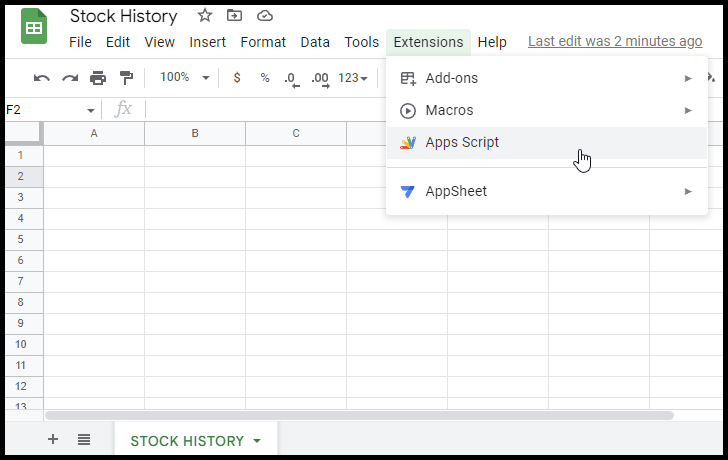
Give the sheet a name. I called mine "STOCK HISTORY". Open the Apps Script.
3. Calling the API
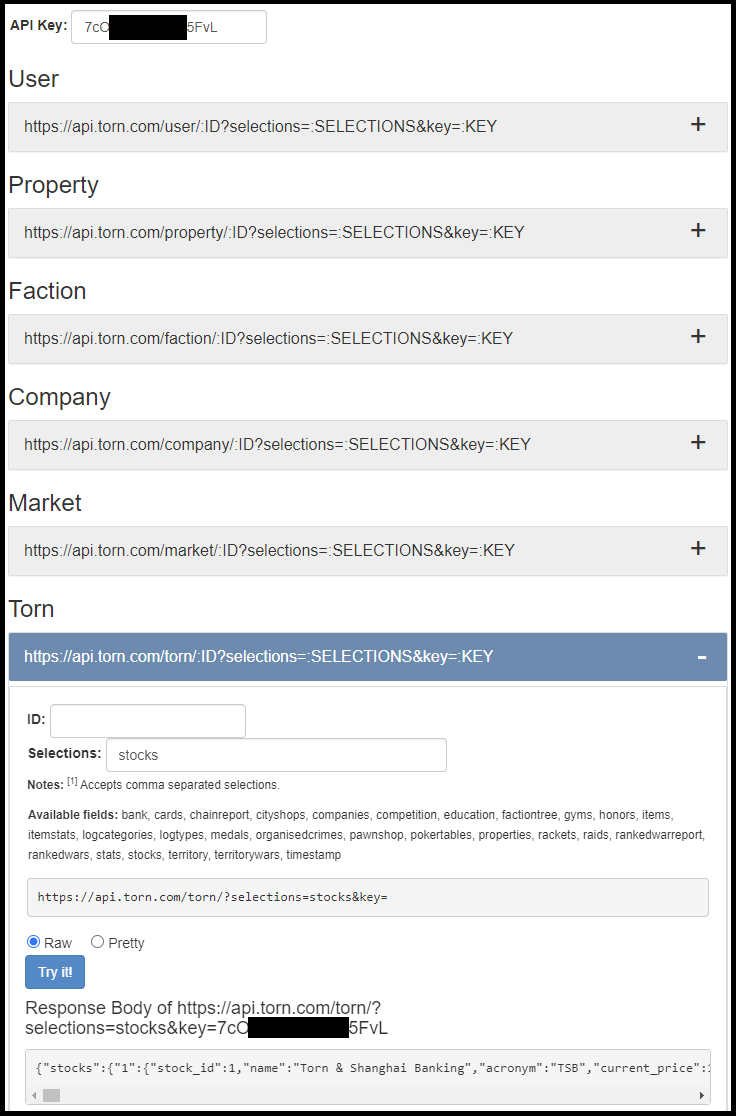
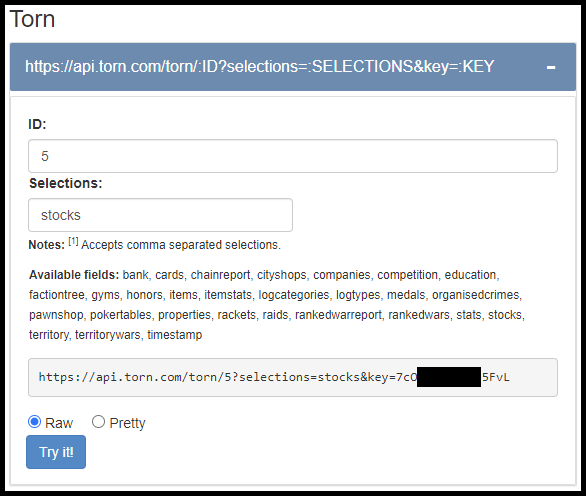
The first thing we should do is populate a table with the existing stock names, symbols/acronyms, and IDs. These will be used as a reference for end-users of the script. The API documentation provides you a way to try making API calls before you use them in your programs:
I like to format the JSON response body in VS Code so it's easier to read:

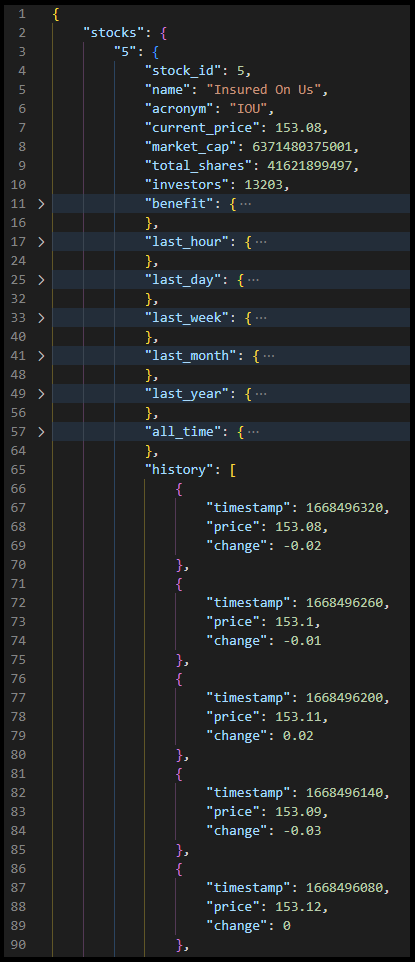
You can see that the JSON response body contains the stock ID, name and acronym, as well as other useful information like it's current price and the type of benefit it provides. We only need the stock ID, name and acronym right now. In the next section we're going to display this info to the user to make it easily accessible.
4. Setting Up the Sheet
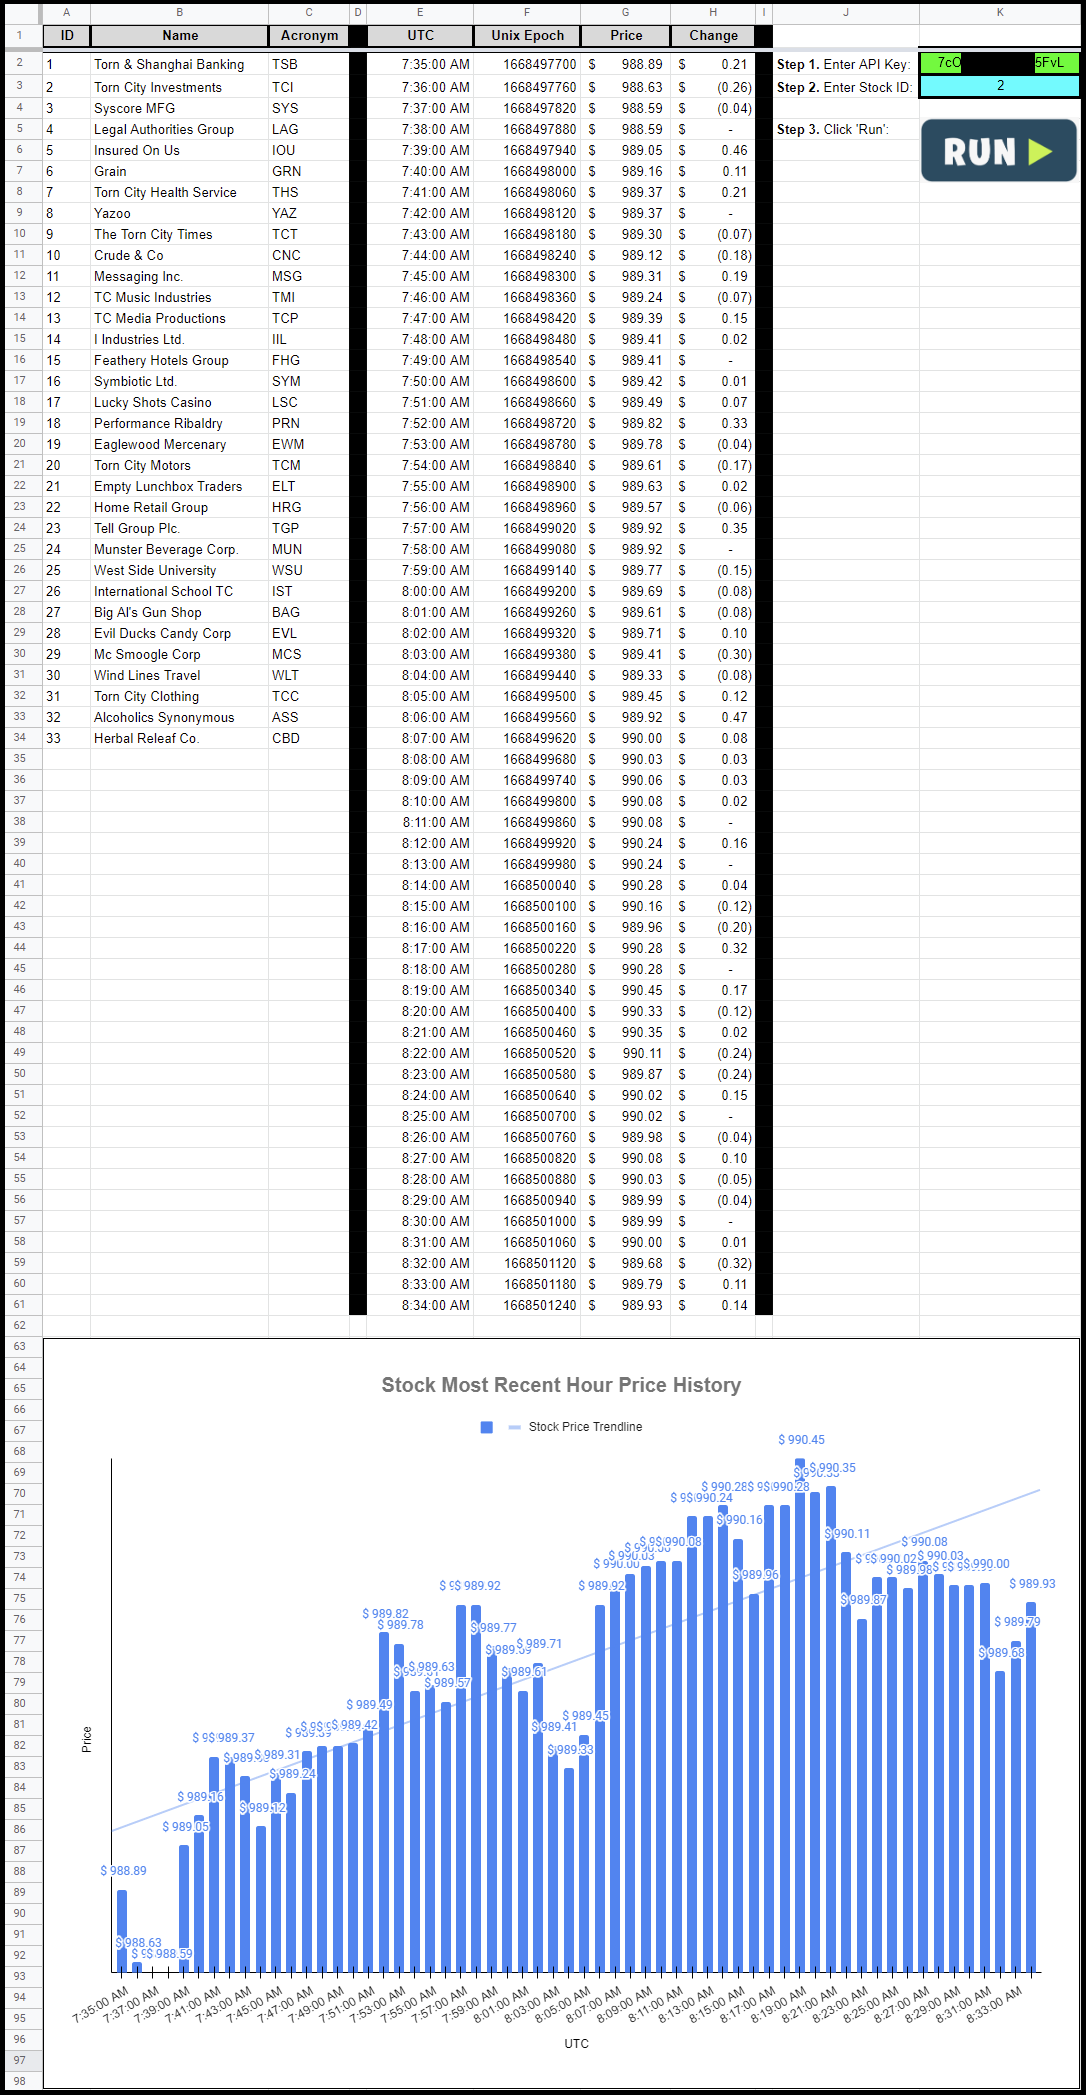
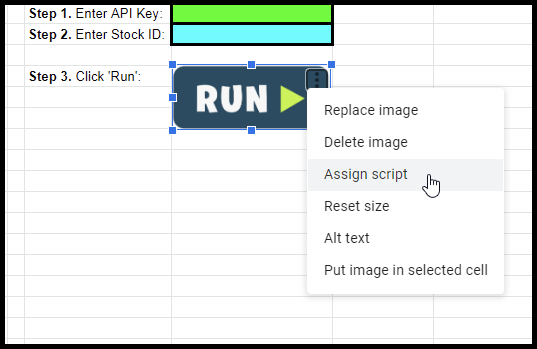
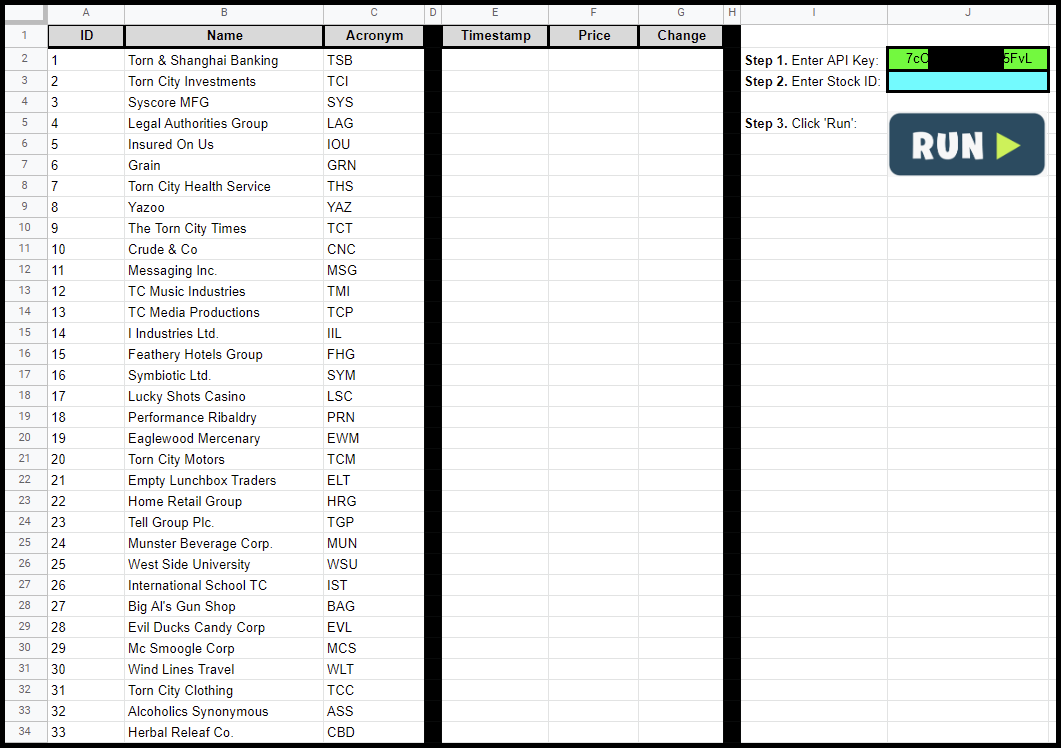
We need to set up the Google Sheet so that the end user knows where to enter both their API key and stock ID as well as to execute the script.
Here is how I laid mine out:
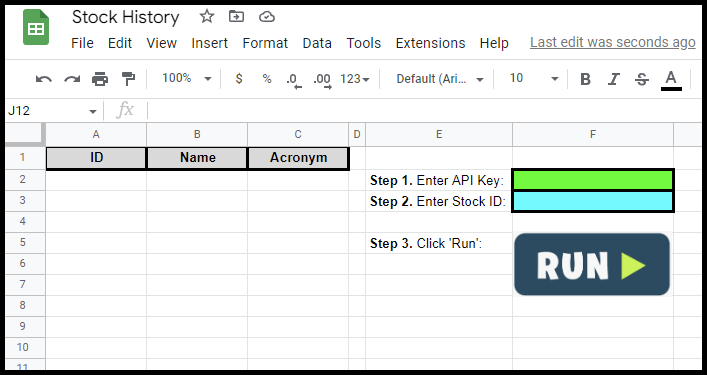
You can insert an image "over the cells". Then by right-clicking the image you left-click the three vertical dots in the upper right to assign a script to the image:
5. Populate Stock Reference Table
The code below does the following things:
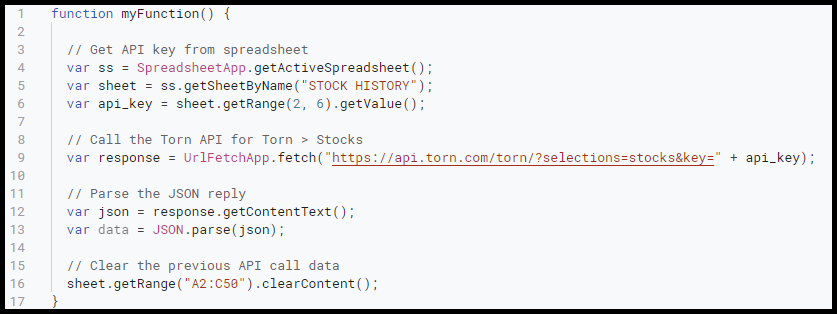
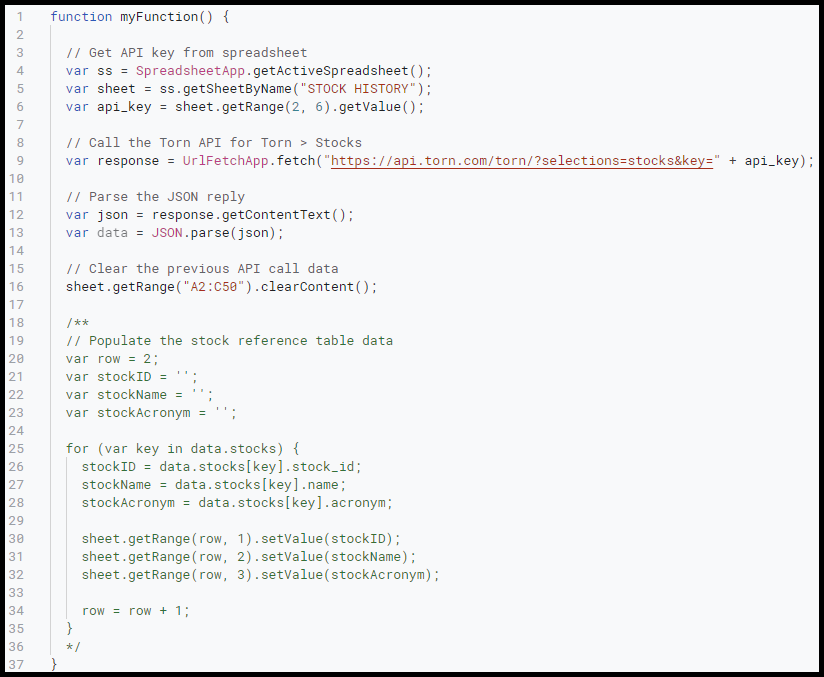
- Tells the script which sheet/tab we're working on (i.e. "STOCK HISTORY").
- Retrieves and stores the API key. We don't want to hardcode it in the function because the user can delete and create new API keys. Hardcoding is also bad, 'mmmkay?
- Calls the Torn API.
- Stores and parses the JSON response body.
- Clears the first three columns of any existing data from previous API calls.
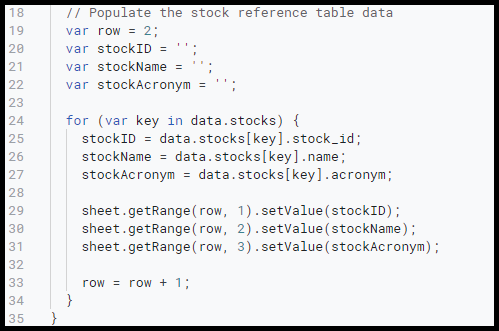
Next we create variables to store the data we want, as well as a row counter to iterate over each row. For each object (aka "key", not to be confused with the API key) we will grab and store the stock ID, name, and acronym into our variables. Then we set the respective cell data with our data, and finally iterate to the next row. We repeat this until there are no more objects/keys in the JSON response body.
When we hit "Run" to execute our script you will be prompted to grant your project access to your linked Google Account:
Once you've done that we can execute the script and get the stock reference table populated:
6. Populate Stock Prices Table
The stock IDs, names and acronyms almost never change so we're going to comment out the code where we populated that data:
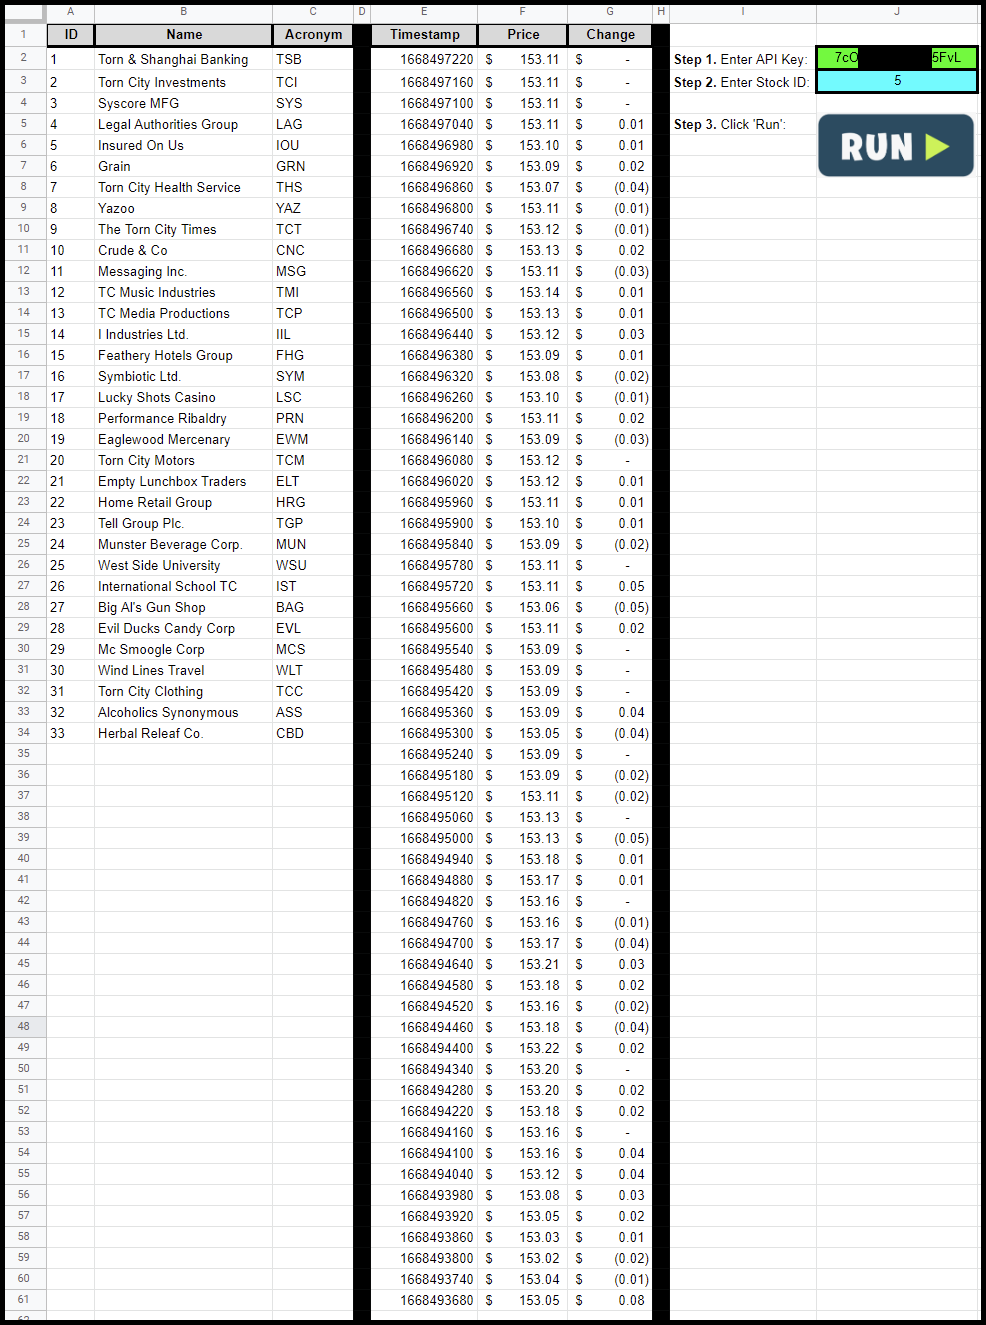
Torn City's API requires us to select a single stock ID before calling the API to retrieve timestamped price data for the last hour of a stock:
This requires us to update the STOCK HISTORY sheet layout:
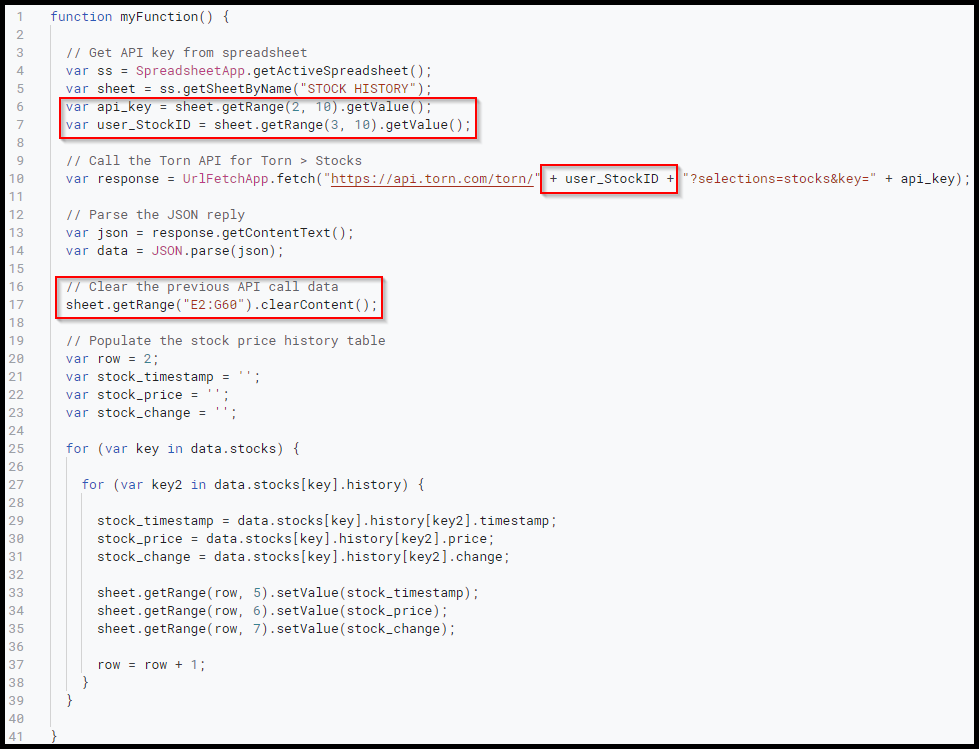
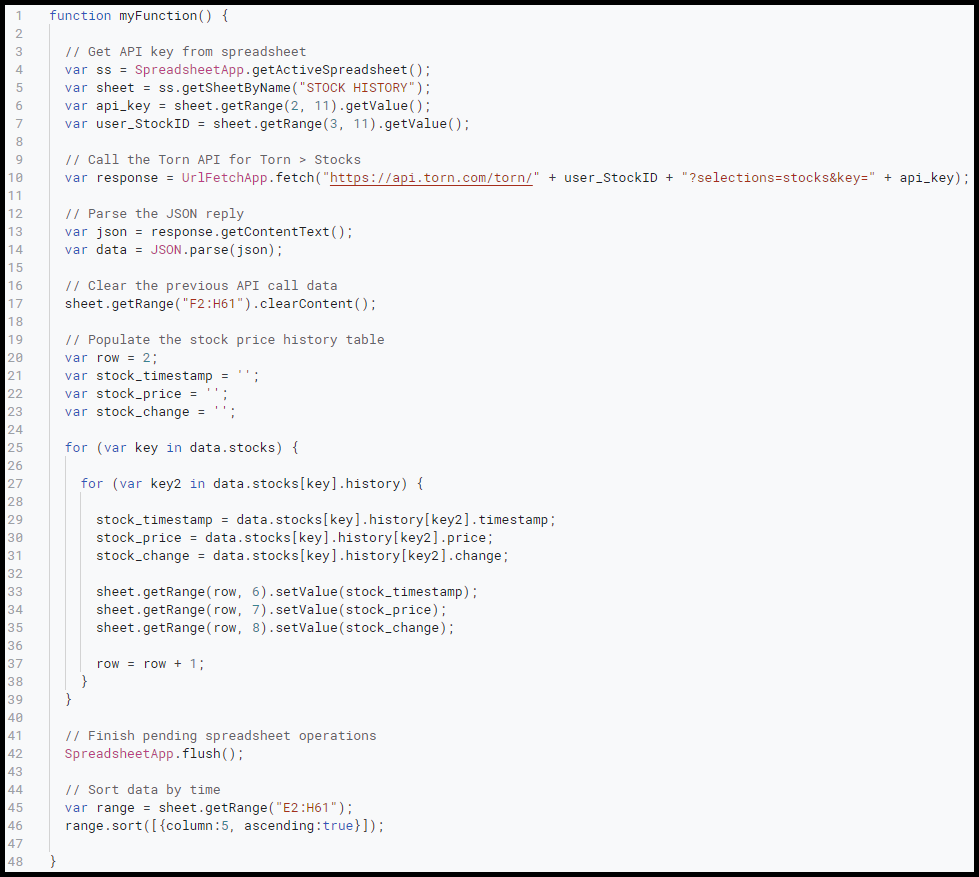
Here is myFunction with the new API call. Keep in mind the red squares for the following changes/additions:
- Removed commented code.
- Store user's stock ID selection into user_StockID variable.
- Update API call with user_StockID.
- Clear the columns which contain the previous API call data.
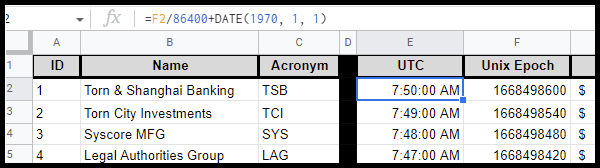
Here is the stock price history of Insured On Us (IOU, ID=5) stock:
You'll notice the timestamp data is returned in Unix Epoch which is not very user friendly. We can make it pretty by converting the timestamp into UTC using the following formula:
If we want to reverse the timestamp order we can do that automatically in the function. See lines 44-46:
7. Create the Graph
The final step is to insert a graph with the appropriate data and make it as simple or as fancy as you'd like. The graph will update each time the script is executed.